

In an era dominated by data, the ability to effectively visualize geographic information is more critical than ever. Whether you’re a researcher analyzing spatial patterns, a planner assessing urban development, or a business owner optimizing logistics routes, the ability to create visually compelling maps can provide valuable insights and drive informed decision-making.
Enter Ùmap – an open-source mapping tool that offers a comprehensive suite of features for efficient geographic data visualization. In this guide, we’ll explore how to leverage Ùmap to unlock the full potential of your spatial data and create compelling visualizations that tell compelling stories about our world.
Getting Started with Ùmap:
- Accessing Ùmap: Whether through the online platform or downloadable software, getting started with Ùmap is easy and accessible.
- Creating an Account: Sign up for a Ùmap account to access additional features and save your work for future use.
- Navigating the Interface: Familiarize yourself with the user-friendly interface, including tools for creating maps, importing data, and customizing visualizations.
Importing Data:
- Supported Data Formats: Ùmap supports a variety of data formats, including CSV, KML, GeoJSON, and shapefiles.
- Uploading Data: Import your geographic data into Ùmap by uploading files directly or linking to external data sources.
- Data Preparation: Ensure your data is properly formatted and organized before importing it into Ùmap for visualization.
Creating Custom Maps:

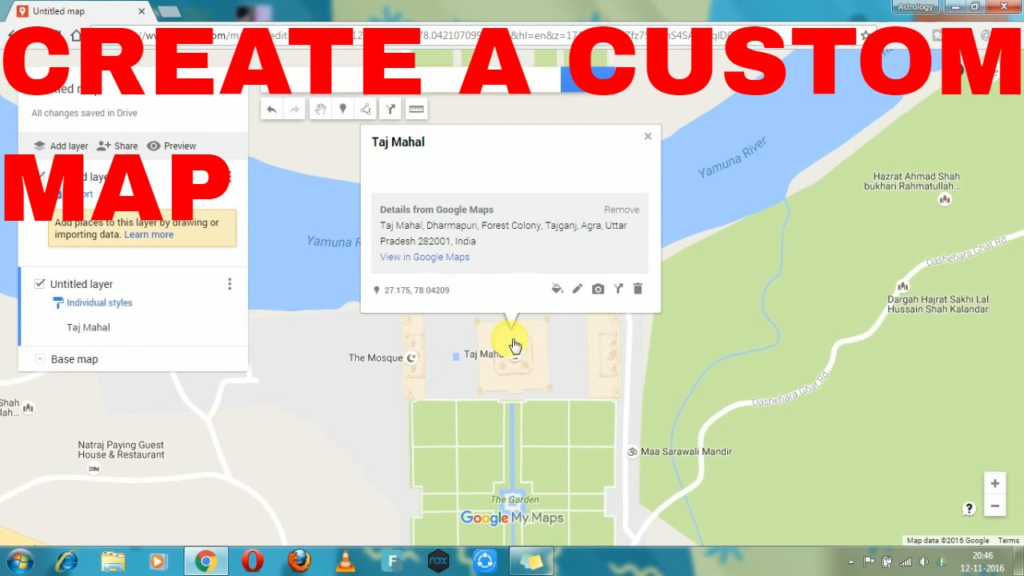
- Adding Layers: Overlay your imported data onto base maps to create custom visualizations that highlight spatial relationships and patterns.
- Styling Layers: Customize the appearance of map layers with different colors, symbols, and labels to enhance readability and convey information effectively.
- Incorporating External Data: Integrate external data sources, such as demographic or environmental datasets, to enrich your maps with additional context and insights.
Analyzing Spatial Relationships:

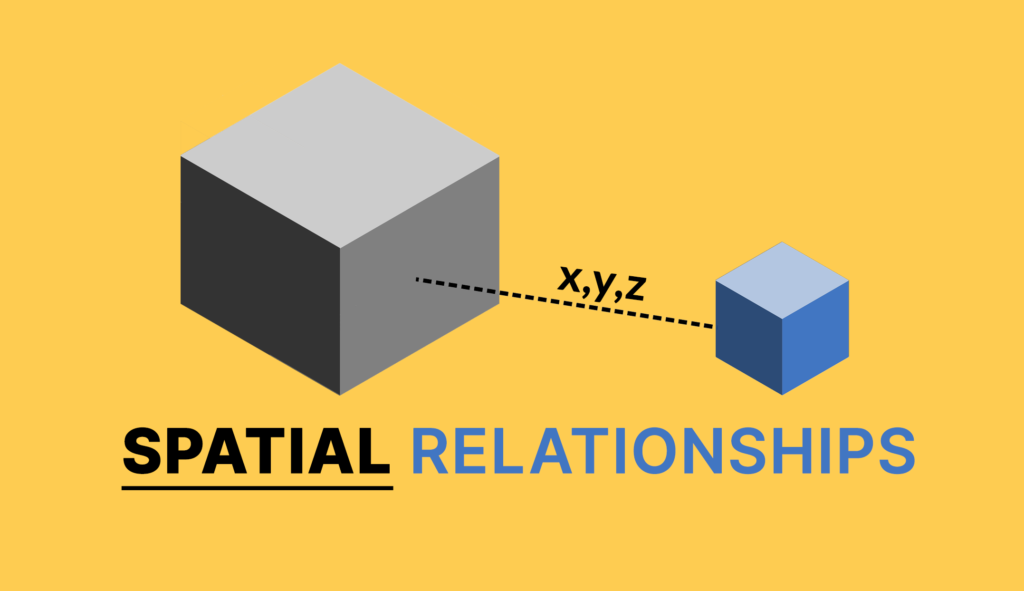
- Spatial Queries: Use Ùmap’s spatial analysis tools to perform queries that identify features within a specified distance or boundary, helping to uncover spatial relationships and patterns.
- Buffering: Create buffer zones around specific features to analyze proximity and spatial interactions, such as identifying areas within a certain distance of a point of interest.
Utilizing Advanced Features:
- Spatial Analysis: Explore Ùmap’s advanced spatial analysis tools to perform complex geospatial operations, such as overlay analysis, nearest neighbor analysis, and hotspot detection, to uncover deeper insights into your data.
- Time-Sensitive Data: If your data includes temporal information, take advantage of Ùmap’s capabilities to visualize changes over time using animations or time sliders, allowing you to track trends and patterns across different time periods.
- 3D Visualization: Experiment with Ùmap’s 3D visualization capabilities to create immersive maps that provide a more realistic representation of terrain and spatial relationships, offering a unique perspective on geographic data.
Sharing Insights:
- Collaboration Features: Collaborate with colleagues or stakeholders by sharing interactive maps via URL links or embedding them into presentations or reports.
- Exporting Maps: Export your maps in various formats, such as images or PDFs, to share with others who may not have access to the Ùmap platform.
- Presenting Findings: Use Ùmap’s presentation mode to showcase your visualizations and findings, providing context and explanations to accompany the maps.
also read: Streamlining Crew Management and Enhancing Security with CrewLogout com
Best Practices for Efficient Visualization:
- Keep it Simple: Avoid cluttering your maps with unnecessary details or layers, focusing on the key information you want to communicate.
- Use Color Wisely: Choose a color palette that is easy to interpret and distinguishes between different map features, such as using contrasting colors for categorical data or gradients for continuous data.
- Provide Context: Include map elements such as legends, scale bars, and north arrows to provide context and help viewers interpret the information presented on the map.
Conclusion:
In conclusion, Ùmap offers a comprehensive suite of features and tools for efficient geographic data visualization, empowering users to create visually compelling maps that communicate complex spatial information effectively. By following best practices, leveraging advanced features, and ensuring data quality and accuracy, users can unlock deeper insights into their data and communicate their findings to diverse audiences. Whether you’re a researcher, planner, educator, or enthusiast, Ùmap provides a versatile platform for exploring and understanding the world through the lens of spatial data.
Frequently Asked Questions:
Can I use Ùmap for commercial purposes?
Yes, Ùmap is open-source software that can be used for both personal and commercial projects. However, be sure to review and comply with any licensing requirements or usage restrictions that may apply to specific datasets or plugins you incorporate into your maps.
Can I collaborate with others on maps created in Ùmap?
Yes, Ùmap offers collaboration features that allow users to share maps with colleagues, stakeholders, or the public via URL links or embedding options. Users can also collaborate in real-time by granting editing permissions to multiple users, enabling collaborative map editing and data visualization.
Can I use Ùmap offline?
Yes, Ùmap offers both online and offline options for accessing and using the platform. Users can choose to use the online web interface for real-time access to mapping tools and data, or download the software for offline use on their desktop or mobile device, allowing for mapping and data visualization in environments with limited or no internet connectivity.
Is Ùmap suitable for large-scale data visualization projects?
Yes, Ùmap is capable of handling large-scale data visualization projects, including datasets with thousands or even millions of spatial features. However, users should be mindful of performance considerations, such as data loading times and map rendering speeds, and optimize their workflows accordingly to ensure smooth and efficient visualization of large datasets.
Can I customize the appearance of my maps in Ùmap?
Yes, Ùmap offers extensive customization options for map styling, including the ability to customize colors, symbols, labels, and basemap styles. Users can also incorporate custom icons, patterns, and fonts to create unique and visually appealing maps that suit their specific needs and preferences.


